

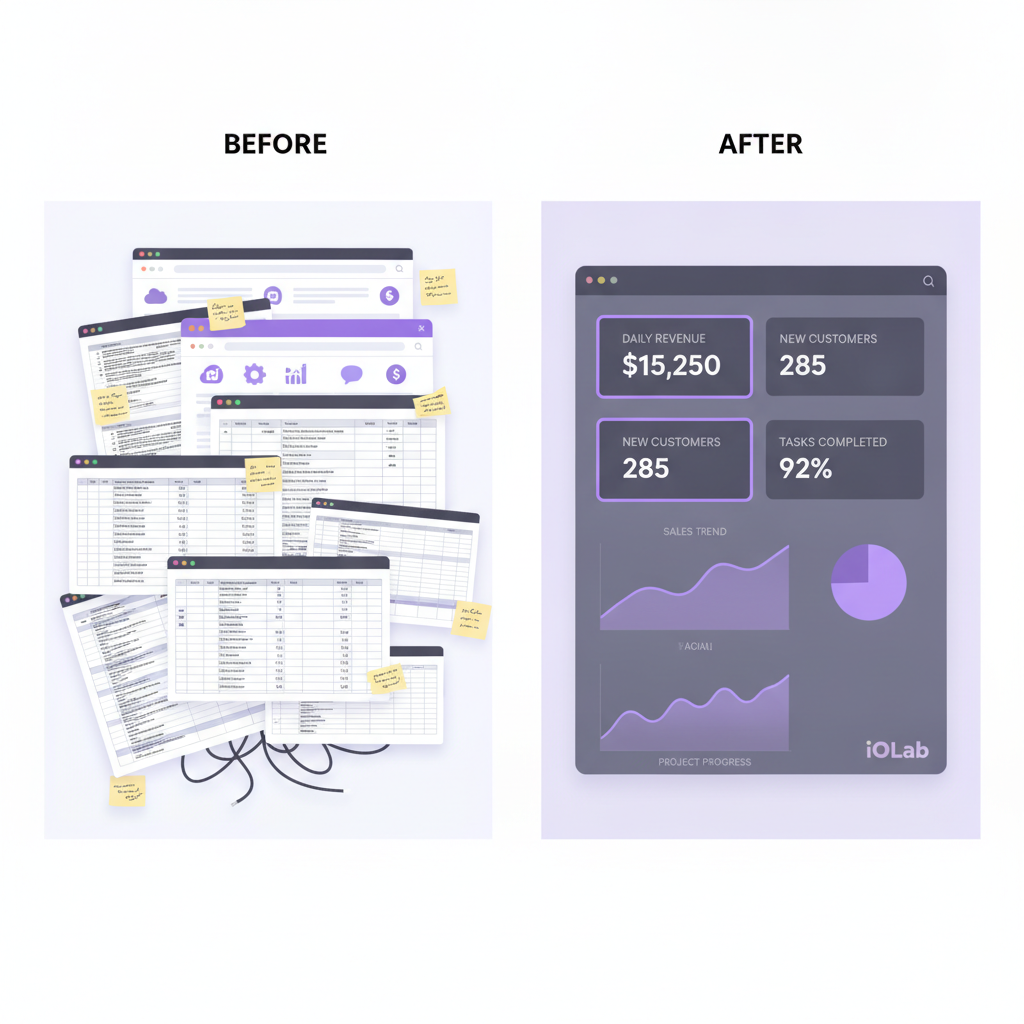
Most small businesses run on numbers that live in four places: the accounting file, the CRM, the point-of-sale system and a spreadsheet someone built years ago. A custom data dashboard for small business pulls those sources into one screen built around the decisions you actually make each week.
A dashboard is not the same thing as AI, and you do not need one to have the other. But once your numbers sit in one place, AI automation for small business gets much easier: alerts, forecasts and plain-English summaries all need clean, connected data underneath. This post covers what a custom dashboard shows, when it beats Power BI or Looker, what it costs, and where we say plainly that we do not know the number.
Why Small Business Dashboards Fail
The usual path is the same. A spreadsheet comes first, then QuickBooks, then a CRM, then a marketing tool. Soon you have seven logins and three definitions of "revenue": one for the bookkeeper, one for sales and one for you.
Off-the-shelf business intelligence tools such as Tableau, Power BI and Looker are meant to fix this. They are capable products. The trouble for a small team is usually not the charts. It is the work around them:
- Connectors break. A dashboard that depends on a third-party connector stops updating when the app behind it changes its export or API. Someone has to notice, then fix it.
- Someone has to own the data model. Deciding what "job profit" or "active customer" means is a business decision. A tool cannot make it for you.
- Generic reports answer generic questions. A restaurant owner needs food cost percentage and menu-item margin. A contractor needs profit by job and invoice aging. A default "revenue by category" chart serves neither.
A custom dashboard starts from the other end. You name the questions, we work out which systems hold the answers, and the screen shows only that. It stops being a reporting tool and becomes a decision tool.
What a Custom Dashboard Actually Looks Like
A custom dashboard is a live web interface that reads from the tools you already use. That might be your CRM, point of sale, invoicing software, marketing platform and inventory system. Each person sees the view that matches their job. The pipeline view the owner opens on Monday should not be the same screen a floor manager glances at every half hour.
Here is how the metric list changes by business type. These are examples of what is possible, not a fixed menu.
Restaurants and food service
- Daily covers and average check
- Food cost and labor cost as a share of sales
- Reservation-to-walk-in mix
- Best and worst menu items this week against last week
- Scheduled hours against actual hours, with an overtime flag
Service businesses: contractors, salons, law firms
- Jobs open, overdue and finished this month
- Invoiced revenue against outstanding invoices, with aging
- Staff at capacity against staff with open time
- Customer acquisition cost by marketing channel
- Recurring against one-time revenue over 12 months
For field-service trades, the data behind these numbers is usually calls, dispatch, equipment history, estimates and invoices. That is the structure of the HVAC and plumbing CRM we build, and a dashboard reads from it directly.
Retail and e-commerce
- Stock levels with low-stock alerts before you run out
- Return rate by product category
- Customer lifetime value by acquisition source
- Cart abandonment and email recovery results
- Fulfillment time and shipping cost per order
Every number on the screen is one you defined. Nothing is there because a vendor decided it was a default.
Real-Time Versus a Report With a Chart on It
Many small business "dashboards" are scheduled reports. They refresh once a day, once a week, or when someone remembers to export a file. By the time you read them, they describe the past.
A live dashboard changes what you can do on the day. Say you run three retail locations. At 11 a.m. on a Tuesday, one store is running well below its usual Tuesday sales. You can call the manager, check staffing or send a same-day email promotion while the day is still open. A weekly report tells you the same thing on Friday, after the day is gone.
Alerts are the more useful half. Instead of you checking the dashboard, it checks itself against thresholds you set. Daily sales fall under a target and you get a Slack message. A task sits overdue for more than two hours and the project view flags it. This is workflow logic, and it is the part of AI workflow automation that pays off first. A person still decides what the threshold is and what to do about it.

Where Prediction Fits (and Where It Does Not)
A dashboard shows what happened and what is happening. Predictive analytics adds a forecast of what is likely next, built from your own history: sales records, customer behavior, seasonality and, where it helps, outside signals such as local events or weather. Four uses are worth considering for a small business.
- Sales forecasting. A model trained on your past sales and pipeline gives a rough range for the next 30, 60 or 90 days. That helps with cash flow, staffing and purchasing.
- Customer churn flags. Falling purchase frequency, fewer email opens, support tickets and late payments can mark an account as at risk. Your team then decides whether to call, send an offer or do nothing.
- Reorder timing. Order history, supplier lead times and seasonality suggest when to reorder and how much. This matters most where freshness or lead time ties up cash, such as restaurants and retailers.
- Marketing focus. Scoring leads by how likely they are to convert helps you put budget where it has paid off before.
Be careful with the promises here. A forecast is only as good as the history behind it. A business with a few months of messy data, or data split across tools that do not match, will get a weak forecast. We do not publish an accuracy figure, because it depends on your data. Every prediction should show the inputs behind it, and a person should review it before it drives a purchase order or a customer call.
You may not need prediction at all. If the real problem is that nobody trusts the numbers, fix that first. A clean, connected dashboard is the foundation, and models come later if they earn their place. If you want to ask your own data questions in plain language, that is a separate layer, covered in our post on internal AI copilots for small businesses in 2026.
The Build-Versus-Buy Math
Start with what the subscription route costs, using a published price. Microsoft's Power BI pricing page listed Power BI Pro at $14.00 per user per month, paid yearly, when we checked it on October 5, 2026. For five people, that is $840 a year in licenses. Check the live page before you budget, because vendors change prices.
That figure is the cheap part, and it does not cover the work around it:
- Building and maintaining the connections to your other systems
- Writing the calculations that match your definitions
- Training the team
- Paying for any extra data-movement tool the connections need
Some of that you do yourself, which is a real cost even if no invoice arrives. Power BI is the right choice when your data lives mostly in Microsoft tools and someone on staff enjoys building reports. A custom dashboard makes more sense when your data is spread across five or six systems, when the view has to match how you work, or when you want an alert that goes to a phone instead of a report that waits in a folder.
What a custom build costs
We have not published a price for a dashboard on its own, so we will not make one up. The published range for custom apps is $15,000 to $100,000+, depending on scope. How many data sources, how many role-based views and how much alert logic you need all move the number. A dashboard added to a CRM or portal we are already building is scoped differently from a standalone one. You own the software under the project agreement and pay no per-seat fee. Hosting, third-party subscriptions and ongoing support sit outside the build and are quoted separately.
Count the manual work too. If your operations manager spends four hours every Monday pulling numbers from different systems, that is 208 hours across 52 weeks. Multiply it by what that person's time costs you. A live view removes most of that pulling, though not the time spent checking that the numbers make sense.
How It Connects to the Tools You Already Use
A dashboard does not replace your tools. It reads from them. Where a tool offers an API (the interface that lets software read your data), we connect through it. QuickBooks, Square, Stripe, Shopify, Google Analytics and HubSpot are typical examples. Your team keeps using what they know, and the dashboard is where the pieces add up.
The weak point is always the connection, not the chart. Third-party apps change their endpoints and enforce rate limits. A good build handles retries and flags stale data on screen, so a number never looks current when it is not. If you have tried stitching tools together with a no-code connector, our write-up on why small businesses are moving from Zapier to custom automation explains where that approach starts to strain.
Invoicing data is a common first source because the dollars are already structured. If receivables are your main blind spot, see how an automated invoicing system feeds aging and cash-timing numbers into a dashboard.
The same principle applies to a larger system. In the wholesale operations platform we built for WRAPT, a nine-stage lead-to-delivery pipeline already defines the stages work moves through. Stages that are defined in the software are what make a pipeline view possible without anyone retyping data.
How to Choose Who Builds It
Whoever you pick, check five things:
- They start with your decisions, not your data. A good first question is which decisions you make every week and what you wish you knew when you make them.
- They design for the actual user. The owner who checks once a week and the manager who glances every half hour need different screens.
- They have connected to your real systems. A mockup is easy. Reliable connections to your actual tools are the hard part.
- They plan alerts from day one. The best moment in a dashboard is when it catches something you would have missed.
- They plan for growth. More sources and more questions will arrive in the next few years. The design should absorb them without a rebuild.
If you are not sure which of your problems deserves the first build, start with a short audit. Our post on a small business workflow audit shows how to pick one fix before you commit a budget.
Frequently Asked Questions
What is a custom data dashboard for a small business?
It is a live screen, built around your operation, that pulls numbers from the tools you already use. That can include your CRM, accounting software, point of sale and marketing platform. It shows only the metrics you chose, in views suited to each role, and can send alerts when a number crosses a threshold you set.
Is a custom dashboard better than Power BI or Tableau?
Not always. Power BI suits teams whose data is mostly in Microsoft tools and who have someone to build reports. A custom dashboard fits better when your data sits in several unrelated systems, when you want role-based views and phone alerts, or when you would rather own the software than rent seats.
Do I need AI to get value from a dashboard?
No. Most of the value comes from connecting your data and agreeing on definitions. Alerts are simple rules. AI forecasting is an optional layer that helps only when you have a solid history of clean data. Even then, a person should review forecasts before they drive purchases, staffing or customer outreach.
How long does it take to build a custom dashboard?
It depends on how many data sources you have and how clean they are. We do not quote a standard timeline here, because connections to your tools and the number of views drive the schedule. A discovery conversation about your decisions and systems gives you a scoped plan in the proposal.
Prices in this article are starting ranges published on iolab.co/pricing. Hosting, third-party subscriptions and ongoing support are scoped separately in your proposal.
If you are in Medford, Burlington County or anywhere in the South Jersey and Philadelphia area, or run a business remotely, tell us which decisions you wish you had better numbers for. We will map which systems hold the answers and what a build would involve before you commit to anything.
Sources
Every outside claim in this article links to where it came from. These open in a new tab.
- Microsoft's Power BI pricing pagemicrosoft.com